AUDPCPlot
AUDPCPlot鸣谢/Acknowledgement最新更新/Updates功能/features生成图展示/Showing the plot of examples使用方法/How to use it讨论/Help&Bugs
制作:张敖 https://datahold.cn Code by Ao Zhang https://datahold.cn
鸣谢/Acknowledgement
阮燕晔,沈阳农业大学,指导 Yanye Ruan, Shenyang Agruicultral University, guide
曹慧颖,沈阳农业大学,测试 Huiying Cao, Shenyang Agruicultral University, testing
最新更新/Updates
【2022-06-08】
完成绘图功能。 Finish the drawing function.
功能/features
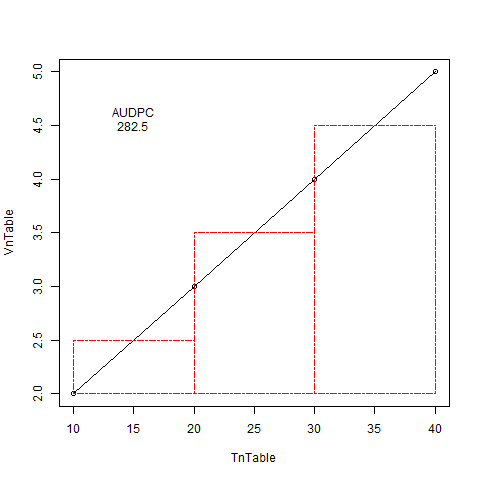
- 绘制AUDPC图像。 Drawing a plot of AUDPC.
- 计算每个材料的AUDPC。 You are calculating AUDPCs for each individual.
生成图展示/Showing the plot of examples
使用方法/How to use it
推荐将所有文件(包括r文件和LD衰减文件)放在同一个目录下,然后在R Studio中运行下列代码。第一个弹窗选择工作目录,第二个弹窗选择要计算的文件(示例:test.txt)。 Please put all the files in the same folder. Then run the following code in the Rstudio software. Select a working folder in the first pop-up window, and then select a file for calculation. Select a working folder in the first pop-up window and select a file for calculation for the second. The example file is test.txt.
海外: Overseas:
rm(list=ls()) # Clear the Environment Variablessource("https://aozhangchina.github.io/R/AUDPCPlot/AUDPCPlot.r") # the internet is required.国内: China:
xxxxxxxxxxrm(list=ls()) # Clear the Environment Variables 清空环境变量 source("https://dataholdcn.cn/R/AUDPCPlot/AUDPCPlot.r") # 加载程序文件,需要联网讨论/Help&Bugs
国内用户请提交Bug或使用中有任何问题,请发邮件到张敖的邮箱。海外用户请在AUDPCPlot - lecent.wang上讨论,我们定期查看。
User in China, please send an e-mail to Ao Zhang to submit a bug. Overseas users please to reply this post (AUDPCPlot - lecent.wang) to discuss any questions about the AUDPC plot.